Geotab Customizable Dashboards
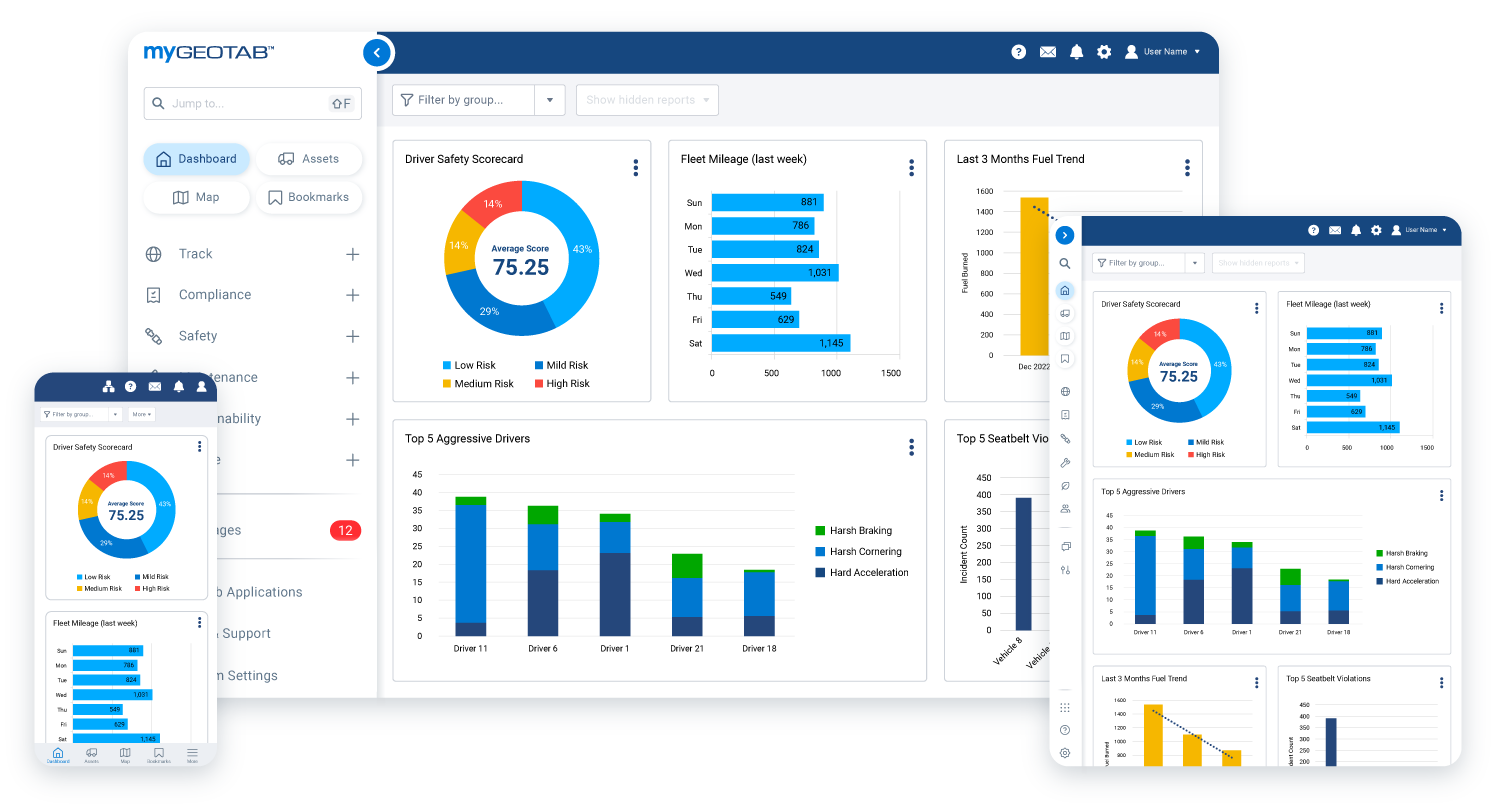
Geotab customizable dashboards give fleet managers a centralized view of the information that matters most to their operations. Within MyGeotab, users can display easy-to-read charts that summarize fleet events, trends, and driver behaviours. Depending on the available vehicle data, reports, rules, permissions, and services, a dashboard can highlight measures related to safety, productivity, fuel use, idling, vehicle utilization, maintenance, compliance, and other fleet priorities. By bringing important information together, MyGeotab dashboards help decision-makers understand fleet performance without reviewing multiple reports separately.
Focus on the Fleet KPIs That Matter Most
MyGeotab allows users to choose which charts appear on their dashboards, helping each organization focus on its most important fleet key performance indicators. Users can add available charts, remove unnecessary ones, rearrange the dashboard, duplicate charts, and edit supported chart settings. For example, a fleet could create separate views of idling performance for different regions or groups. This flexibility reduces visual clutter and makes important trends easier to recognize, allowing managers to spend less time searching for data and more time addressing safety risks, operating costs, vehicle use, and productivity concerns.

Give Each Team a More Relevant Dashboard
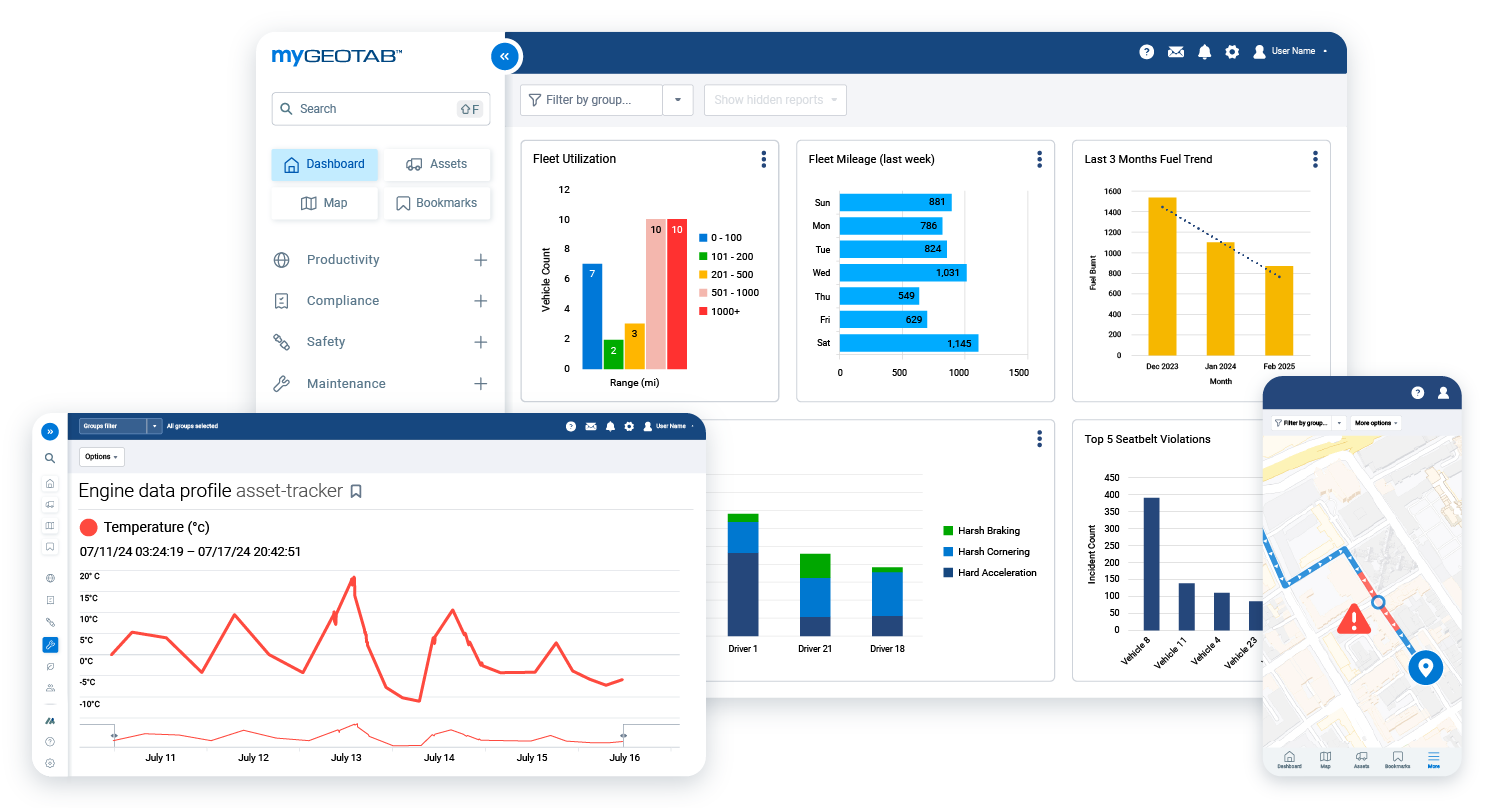
Geotab dashboards can be configured for different users, groups, and operational responsibilities. Authorized administrators can manage who sees particular charts, while group filtering allows users to focus on the vehicles and drivers relevant to their work. A safety manager may prioritize driver behaviour and exception information, while a maintenance or operations team may focus on vehicle condition, utilization, fuel consumption, or productivity. Giving employees access to more relevant fleet insights can simplify daily monitoring, support faster decisions, and help prevent users from being overwhelmed by information outside their responsibilities. Available charts and data remain subject to each user’s permissions and database configuration.
Move from High-Level Trends to Detailed Reports
Interactive MyGeotab charts do more than summarize fleet performance. Users can select supported chart data to open a pre-filtered report and investigate the records behind a trend. Charts can also be downloaded, and related reports can be scheduled for email delivery to specified users. Authorized users may configure the data shown, select how often supported charts refresh, and create custom dashboard charts from available reports. These capabilities help fleets move efficiently from identifying an issue to understanding its cause, whether they are reviewing repeated speeding, excessive idling, underused assets, fuel performance, or another measurable concern.

Build a MyGeotab Dashboard Around Your Fleet Goals
A well-configured Geotab dashboard can make complex fleet information easier to understand, share, and act upon. GPS Tracking America can help your organization select useful fleet metrics, configure relevant dashboard charts, organize access for different teams, and connect dashboard insights with your broader safety, productivity, maintenance, and cost-control objectives. The specific information available depends on your tracking hardware, collected data, MyGeotab permissions, enabled services, and system configuration. Contact us to learn how a customizable MyGeotab dashboard can support clearer reporting and more informed fleet management.
What is a customizable dashboard in MyGeotab?
A customizable MyGeotab dashboard is a centralized visual workspace that presents important fleet information through easy-to-read charts. Users can select and organize charts that reflect their safety, productivity, maintenance, fuel, compliance, and other operational priorities.
What information can a Geotab dashboard display?
Depending on the available vehicle data, reports, rules, permissions, and enabled services, a Geotab dashboard can display information about driver behaviour, speeding, idling, fuel consumption, vehicle utilization, maintenance, compliance, productivity, and other fleet performance indicators.
Can I choose which charts appear on my MyGeotab dashboard?
Yes. Authorized users can select which available charts appear on the dashboard. Unnecessary charts can be removed so the dashboard emphasizes the fleet metrics most relevant to the user or organization.
Can MyGeotab dashboard charts be rearranged?
Yes. Users can drag and rearrange dashboard charts to create a more logical layout. For example, safety-related charts can be placed together while fuel, maintenance, and productivity charts are organized into other areas.
Are MyGeotab dashboard charts interactive?
Many MyGeotab dashboard charts are interactive. Users can select supported data within a chart to open a pre-filtered report and examine the detailed fleet records behind the summarized information.
Can dashboard charts be edited in MyGeotab?
Yes. Authorized users can edit supported charts to change the information they display. Available settings vary by report type but may include data configuration, refresh frequency, archived asset visibility, and dashboard viewers.
Can I duplicate a Geotab dashboard chart?
Yes. MyGeotab allows supported dashboard charts to be duplicated and configured separately. This is useful when a fleet wants to compare the same metric across different vehicle groups, departments, branches, or geographic regions.
Can the MyGeotab dashboard show data for specific fleet groups?
Yes. Users can filter the dashboard to view information for selected groups within the fleet. This can help regional managers, dispatchers, safety teams, and other employees concentrate on the vehicles or drivers relevant to their responsibilities.
Can different users have different Geotab dashboards?
Yes. Dashboard visibility can be configured for individual users or groups. This allows organizations to provide employees with charts that support their roles while limiting access according to their MyGeotab permissions.
Can administrators control who sees a dashboard chart?
Yes. Authorized administrators can specify which users or groups can view supported charts. MyGeotab also displays the number of users who will receive access as individual viewers or groups are added or removed.
Does MyGeotab include preconfigured dashboard charts?
Yes. MyGeotab provides available charts that users can add to their dashboards. New users may also see role-relevant charts or sample data that demonstrates how fleet information can be presented before sufficient operational data is available.
Can I create a custom dashboard chart in MyGeotab?
Yes. Authorized users can create custom dashboard charts from supported MyGeotab reports. Configuration options vary according to the selected report and the data available in the fleet database.
Can custom reports appear on the MyGeotab dashboard?
Yes. MyGeotab supports built-in reports and properly configured custom report templates. Eligible reports can be set up for dashboard display, allowing an organization to monitor information that reflects its specific operating requirements.
How often does a MyGeotab dashboard update?
Update timing depends on the chart, report configuration, data availability, device communication, and system settings. Authorized users can configure how often supported chart data refreshes, but dashboard information should not automatically be treated as instantaneous.
Can Geotab dashboard reports be downloaded?
Yes. Users can download reports associated with charts added to their dashboards. This makes it easier to review detailed information, retain records, or share fleet performance data with authorized stakeholders.
Can MyGeotab dashboard reports be emailed automatically?
Yes. Supported chart reports can be scheduled for email delivery to specified users. Scheduled reporting helps managers and other authorized employees receive recurring fleet information without manually downloading the same report each time.
Can archived vehicles be excluded from dashboard charts?
Yes. Supported chart settings include an option to hide archived assets. Excluding inactive vehicles can help ensure that dashboard results remain focused on the fleet currently being managed.
Can Geotab dashboard charts use customized fleet rules?
Some dashboard charts are powered by MyGeotab rules. When supported, authorized users can view or edit the rules behind a chart so that the displayed information better reflects the organization’s policies and operating standards.
What are the benefits of customizable dashboards for fleet management?
Customizable dashboards bring important fleet indicators into one visual location. They can help managers recognize trends, identify concerns, compare performance, reduce time spent searching through reports, and make more informed decisions about safety, costs, maintenance, utilization, and productivity.
Can GPS Tracking America help configure a MyGeotab dashboard?
Yes. GPS Tracking America can help businesses identify useful fleet metrics and configure MyGeotab dashboard charts around their operational goals. Contact us to discuss your fleet, available data, reporting requirements, user access needs, and Geotab solution options.