Fleet Reports and Analytics

Fleet Reports and Analytics
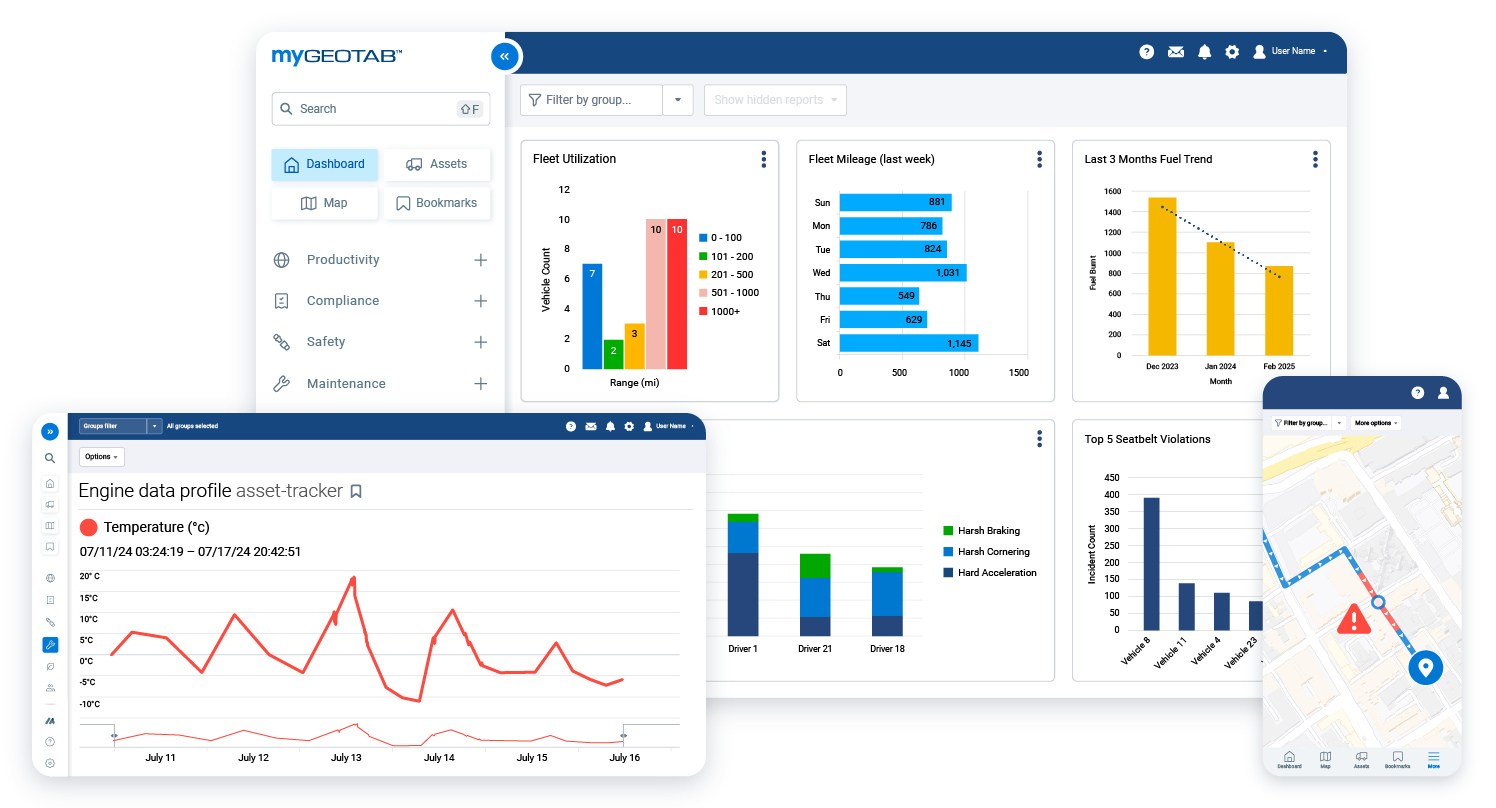
A GPS tracker is only as useful as what you can learn from its data. Reports and Analytics turn thousands of daily data points (trips, stops, speeds, idling, engine faults, fuel and more) into clear answers you can act on. You start with a library of ready-made reports in MyGeotab, tailor them to your fleet, and have them delivered to the right people on a schedule. Nobody has to dig through spreadsheets.
Ready-Made Reports That Work From Day One
MyGeotab ships with a full set of standard reports, grouped by what you’re trying to accomplish:
- Productivity: Trips history with a breadcrumb trail, customer visits, time card logs, planned vs. actual routes, asset utilization and driver congregation events.
- Safety: Driver safety scorecards, speed profiles (actual vs. posted speeds), speeding and aggressive driving, idling, and accident and collision data.
- Maintenance: Maintenance due and maintenance history, engine faults and measurements, and mileage reports.
- Compliance: Hours of Service logs and violations, driver availability, IFTA and time card reports.
- Sustainability and EV: Fuel and energy usage, EV charging history, and battery state of charge, state of health and range.
Reports Delivered to Your Inbox, Automatically
Schedule any report to run daily, weekly, monthly or on a custom interval. It arrives by email as a PDF or Excel file, sent to individuals or whole groups, so owners, dispatchers, safety managers and accounting each get what they need without logging in. Very large reports may need to be downloaded directly from MyGeotab instead of emailed.


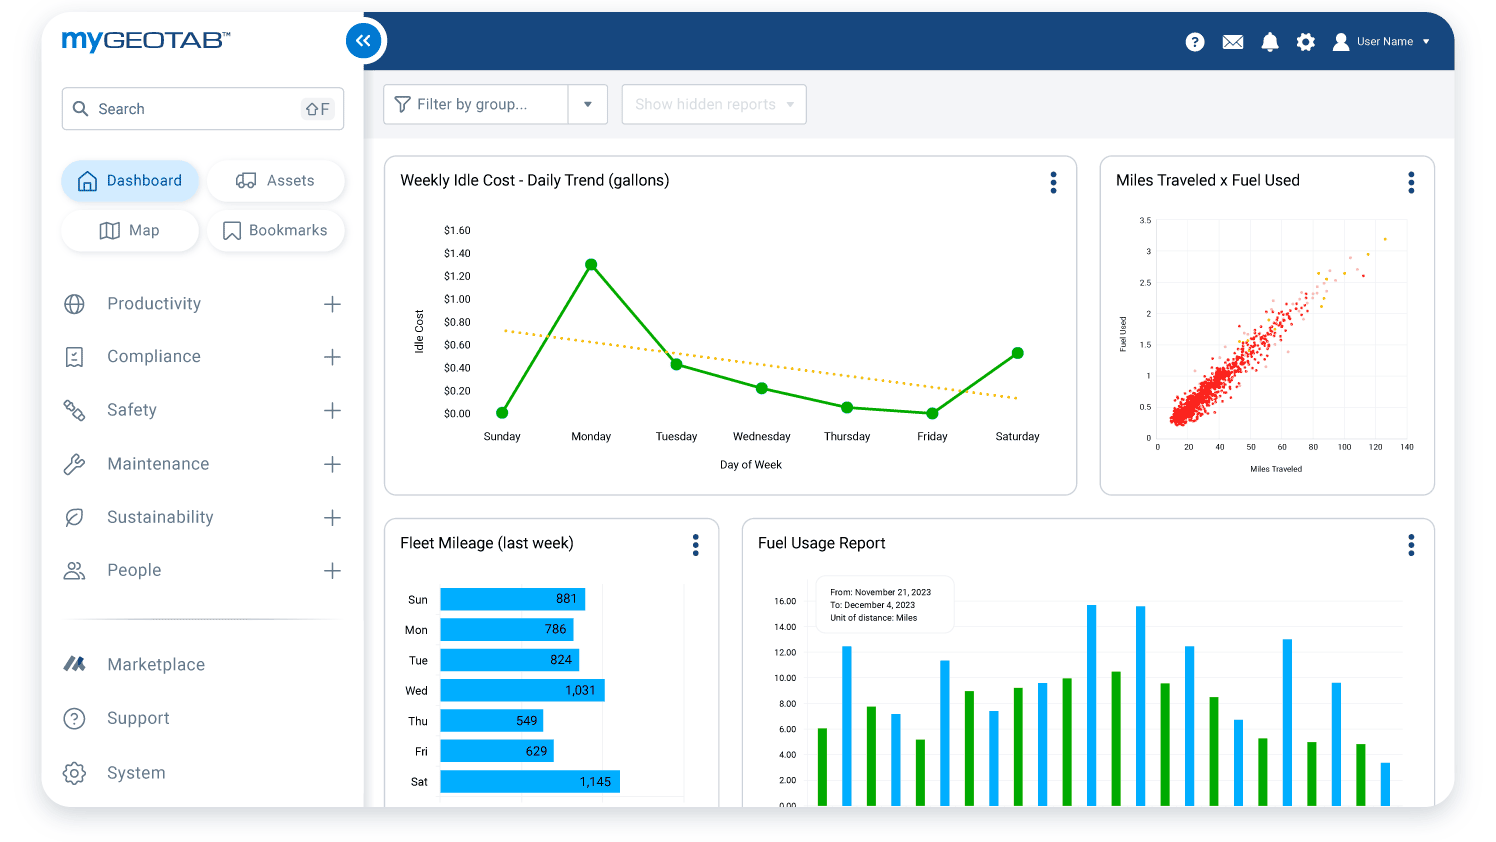
- Fuel efficiency and idle time: Spot wasted fuel and routing problems.
- Vehicle utilization: Find under-used vehicles and right-size your fleet.
- Maintenance compliance: Catch overdue service and fault codes before they become breakdowns.
- Driver safety scores: Combine speeding, harsh braking and other behaviors into one score that supports coaching.


- Geotab Data Connector feeds clean, curated fleet data into BI tools like Power BI, Tableau and Excel. You can combine it with your own financial or HR data and use pre-built templates that refresh automatically.
- Geotab Ace is a generative AI assistant that lets you ask questions about your fleet data in plain language. Availability depends on your plan and database.
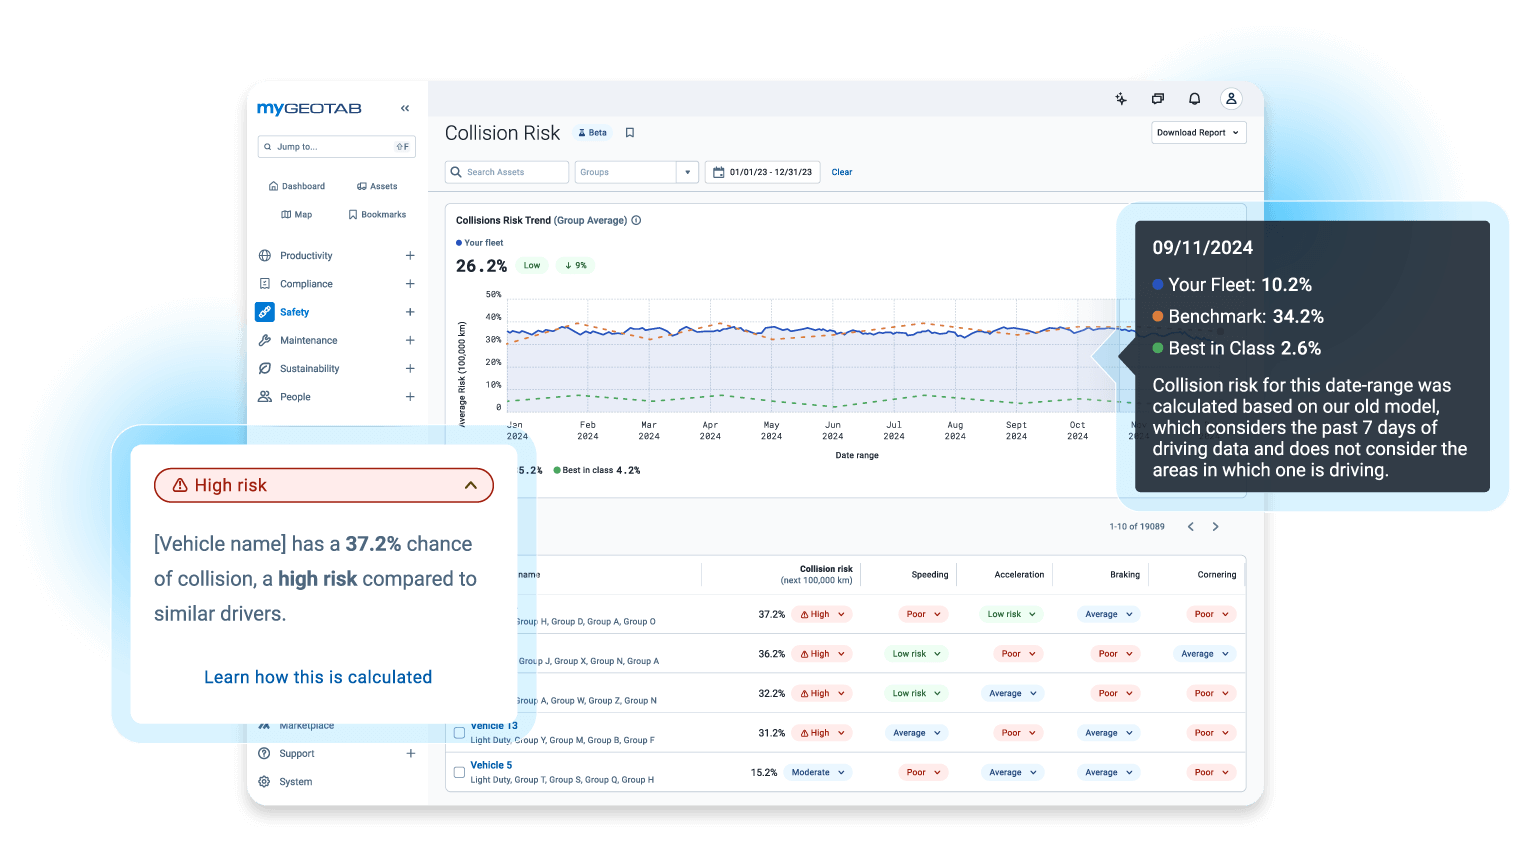
- Collision Risk helps you see which drivers and conditions carry the most risk.
Stop Guessing. Start Seeing Where Your Fleet Stands.
Wasted fuel, unverified hours, missed maintenance and risky driving all show up in your fleet data. Talk with one of our specialists about which reports would uncover the biggest savings for your business.
Frequently Asked Questions
What is fleet reporting and analytics?
Fleet reporting turns the raw data collected by your GPS tracking devices into organized, easy-to-read information. Analytics goes a step further by helping you spot trends, compare performance over time and decide what to change. Together they show you where you’re losing money on fuel, overtime and maintenance, and where your drivers and vehicles are performing well.
What kinds of reports are included?
MyGeotab includes ready-made reports for productivity (trips history, customer visits, time cards, planned vs. actual routes), safety (driver scorecards, speed profiles, speeding, idling, collisions), maintenance (maintenance due, engine faults, mileage), compliance (Hours of Service, IFTA, violations) and sustainability (fuel usage, EV charging and battery health).
Can I customize the reports?
Yes. You can filter standard reports by vehicle, driver, group and date range, and group vehicles by type, department or service status. You can also build custom reports or add specialized reports from the Geotab Marketplace if you need something beyond the standard library.
Can reports be emailed to me automatically?
Yes. You can schedule reports to run at the interval you choose and have them emailed to individuals or entire groups as a PDF or Excel file. This is a convenient way to get a timesheet, a safety summary or a maintenance list without logging in. Very large reports may need to be downloaded directly from the software rather than emailed.
What is the difference between the dashboard and reports?
The dashboard is a visual snapshot of your most important numbers, built for quick daily check-ins. Reports cover a set period of history in more detail and are better for audits, compliance checks, performance reviews and management summaries. Most fleets use both.
Can I track driver performance with reports?
Yes. The Driver Safety Scorecard combines behaviors such as speeding and harsh braking into a score for each driver, and the speed profile report compares actual speeds with posted limits. These reports are the foundation for fair, data-based driver coaching.
Can reports help with employee timesheets and billing?
Yes. Trips history and time card reports show when vehicles started and finished work, and customer visit reports confirm which locations were visited and for how long. Many companies use this information to verify hours, back up customer invoices and settle disputes.
Can I see reports for electric vehicles?
Yes. EV reports cover battery state of charge, battery health, energy usage, charging history and real-world range. They help you assign each electric vehicle to routes it can handle and plan when batteries may need attention.
Can I use my own business intelligence tools like Power BI or Excel?
Yes. Geotab Data Connector sends curated fleet data into popular business intelligence tools such as Power BI, Tableau and Excel. This lets you combine telematics data with your own financial or HR data and build your own dashboards. Availability depends on your plan, so ask us which options are included with your service.
Can I control who sees which reports?
Yes. MyGeotab uses user permissions and security clearances, so each person sees only the data relevant to their role. For example, a dispatcher can see vehicle locations and trips, while accounting only receives mileage and time card reports.
How do reports and alerts work together?
Reports show you what has already happened, and alerts tell you when something happens right now. Many fleets use alerts for urgent events such as speeding or after-hours use, and reports for the weekly or monthly picture. Together they help you manage by exception instead of reviewing every trip.
How up to date is the data in my reports?
Vehicle data is sent from the tracking device to the cloud throughout the day, so reports reflect recent activity. How often a particular dashboard or scheduled report refreshes depends on how you set it up, so it’s worth confirming the refresh period for any report you rely on for decisions.
Do I need special training or technical skills to use reports?
No. The standard reports work out of the box, and the interface is web-based and designed for fleet managers, not data analysts. Geotab also offers free learning resources through its Academy and support site, and we’re happy to help you set up your first reports and schedules.
Can I get reports on my smartphone or tablet?
Yes. Because MyGeotab is web-based, you can open it from any browser, and scheduled reports arrive by email, so you can read PDFs and Excel files on your phone or tablet. The Geotab mobile apps also let you check on your fleet on the go.